BOS/CHoCH + EC + FVG + RSI
Advanced Market Structure & Pattern Recognition System
Overview
The BOS/CHoCH + EC + FVG + RSI indicator represents a comprehensive market structure analysis system that combines multiple technical analysis methodologies into a single, cohesive trading tool. This indicator identifies high-probability trading opportunities by detecting Break of Structure (BOS) and Change of Character (CHoCH) patterns, validating them with engulfing candle formations, Fair Value Gap (FVG) presence, and RSI divergence confirmation.
The indicator is designed for traders who understand Smart Money Concepts (SMC) and seek confluence-based entry signals. By requiring multiple conditions to align, the system filters out low-probability setups and focuses on scenarios where institutional activity is likely occurring.
Primary Use Case
This indicator excels in identifying retest opportunities after significant market structure breaks. It's particularly effective in trending markets where institutional traders are creating liquidity voids (FVGs) and establishing new market structure.
Key Innovation
The unique aspect of this system is its multi-layered filtering approach. Unlike simple BOS or CHoCH indicators, this tool requires engulfing candles to occur within Fair Value Gaps AND validates the momentum shift through RSI divergence analysis. This creates a high-confidence signal generation system that significantly reduces false positives.
Market Conditions
Most effective during trending phases with clear structure, particularly after strong directional moves that create FVGs. Works across all timeframes but shows optimal performance on 15-minute to 4-hour charts where structure is more reliable and FVGs are more significant.
Methodology & Logic
Market Structure Detection
The indicator employs a three-phase processing system that analyzes historical price data to identify pivots (swing highs and lows) using a two-candle confirmation pattern. Once pivots are established, the system monitors for breaks of these levels to detect BOS (continuation) or CHoCH (reversal) patterns.
Signal Generation Components
- BOS/CHoCH Identification: Detects when price closes beyond established pivot levels, classifying the break as either structure continuation (BOS) or change (CHoCH)
- Engulfing Candle Detection: Identifies bullish or bearish engulfing patterns with configurable tolerance for micro-gaps
- Fair Value Gap Analysis: Monitors for price imbalances (gaps) in three-candle sequences and tracks their mitigation
- RSI Divergence Filter: Compares RSI values between the internal pivot within a BOS zone and the current retest candle to confirm momentum shifts
Visual Output
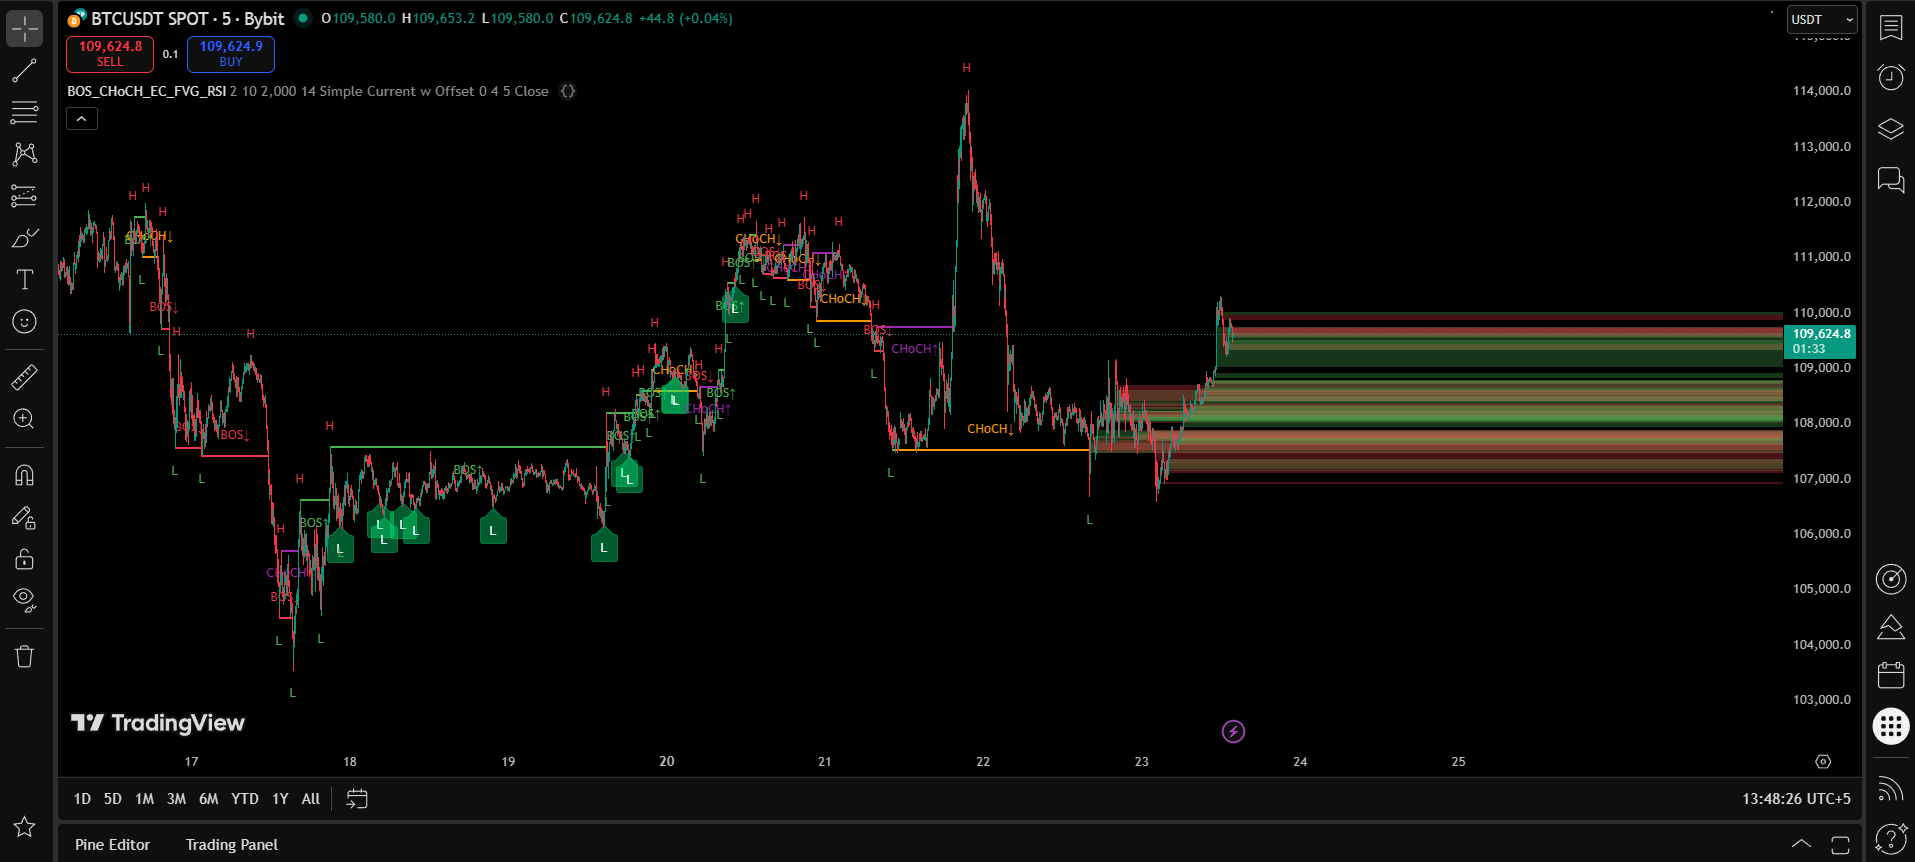
The indicator displays labeled pivot points (H for highs, L for lows), horizontal lines showing BOS/CHoCH zones, color-coded FVG boxes (green for bullish, red for bearish), and entry signal labels (L for long, S for short) when all conditions align.
Alert Conditions
Signals are generated when price retests a BOS zone, forms an engulfing candle within an FVG, and RSI confirms the directional bias. The system specifically looks for retests of the high/low of the pivot candle that created the BOS.
Parameters & Settings
| Parameter | Default Value | Range | Description |
|---|---|---|---|
| Pivot Search Window | 2 | 1-10 | Number of bars to check on each side for local highs/lows |
| Pattern Confirmation Window | 10 | 5-50 | Bars to search for two-candle confirmation pattern |
| Data Storage Size | 4000 | 100-5000 | Historical bars retained in memory for analysis |
| Enable RSI Filter | True | On/Off | Requires RSI divergence for signal confirmation |
| RSI Length | 14 | 2-50 | Periods used for RSI calculation |
| RSI Calculation Method | Simple | Simple/Wilder's | Method for calculating RSI (SMA vs. exponential smoothing) |
| Retest Proximity Threshold | 5 pips | 0+ | How close price must be to BOS zone for valid signal |
| FVG Mode | Current w Offset | Infinite/Current | How FVG boxes extend to the right |
| FVG Right Offset | 4 | 0+ | Bars to extend FVG boxes forward |
Customization Guidance
For Intraday Trading: Reduce Pivot Search Window to 1-2 and Pattern Confirmation Window to 5-8 for faster signal generation on lower timeframes.
For Swing Trading: Increase Pivot Search Window to 3-4 and Pattern Confirmation Window to 15-20 to ensure only significant structure is captured.
Volatile Markets: Increase Retest Proximity Threshold to 8-10 pips to account for price noise around zones.
Trending Markets: Enable RSI Filter with Wilder's Smoothing for more sensitive momentum confirmation.
Technical Specifications
| Specification | Details |
|---|---|
| PineScript Version | v6 |
| Indicator Type | Overlay (plots on price chart) |
| Maximum Visual Objects | 500 labels, 500 lines, 500 boxes |
| Timeframes | All timeframes supported (1m to 1W+) |
| Asset Classes | Forex, Crypto, Stocks, Indices, Commodities |
| Data Processing | Three-phase: Collection → Historical Analysis → Real-time |
| Anti-Repainting | Uses confirmed bars with barstate.isconfirmed |
| Memory Management | Automatic cleanup of old data beyond storage limit |
Pip Calculation System
The indicator includes adaptive pip calculation that automatically adjusts for different asset classes:
- Forex pairs: 0.0001 (0.01 for JPY pairs)
- Crypto: Adaptive based on price level (BTC uses 1.0 pip = $1)
- Stocks: 0.01 (1 cent)
- Indices/Commodities: Based on minimum tick size
Visual Documentation
Usage Guide
Interpreting the Indicator
Pivot Labels: "H" labels mark swing highs (red), "L" labels mark swing lows (green). These are the reference points for structure breaks.
BOS Lines: Solid horizontal lines (green for bullish, red for bearish) connect pivots when structure is broken in the trend direction.
CHoCH Lines: Horizontal lines (purple for bullish, orange for bearish) indicate potential trend reversal when opposite structure is broken.
FVG Boxes: Semi-transparent boxes (green for bullish, red for bearish) show price imbalances that often attract price for retest.
Entry Signal Interpretation
Long Signals (L label): Appear below price when all conditions align:
- Previous bullish BOS has been established
- Price returns to retest the BOS zone (high of the pivot candle)
- A bullish engulfing candle forms within a bullish FVG
- RSI shows lower reading than the internal pivot low (optional but recommended)
Short Signals (S label): Appear above price when:
- Previous bearish BOS has occurred
- Price returns to retest the BOS zone (low of the pivot candle)
- A bearish engulfing candle forms within a bearish FVG
- RSI shows higher reading than the internal pivot high (optional)
Best Practices
- Confluence with Higher Timeframes: Verify that signals align with the trend on at least one higher timeframe
- Volume Confirmation: Look for increased volume on the engulfing candle for additional confirmation
- Risk Management: Place stops beyond the FVG zone (for longs, below the FVG low; for shorts, above the FVG high)
- Target Setting: Look for the next significant structure level (opposite pivot) as initial target
- Signal Quality: Signals that occur after clean, obvious structure breaks tend to be more reliable
Common Scenarios
Scenario 1 - Strong Trend Continuation: Multiple BOS patterns in the same direction with clean FVG retests typically indicate strong trending conditions. Take signals in the trend direction.
Scenario 2 - Trend Reversal: When CHoCH appears after extended trend, wait for the first BOS in the new direction before taking signals to confirm the reversal.
Scenario 3 - Choppy Market: If BOS and CHoCH alternate frequently within small range, reduce position sizing or avoid trading until clear structure emerges.
Implementation Notes
Installation & Setup
- Open TradingView and navigate to the chart where you want to use the indicator
- Click on "Indicators" at the top of the chart
- Search for "BOS_CHoCH_EC_FVG_RSI" in your private indicators (if you have the code)
- Click to add the indicator to your chart
- The indicator will begin its three-phase initialization automatically
Initial Loading
When first added to a chart, the indicator goes through three phases:
- Phase 1: Collects all available historical bar data into memory
- Phase 2: Analyzes historical data to identify all pivots and structure
- Phase 3: Switches to real-time processing for new bars
You'll see debug labels (if enabled) indicating when each phase completes. This is normal and only happens on initial load.
Optimization Tips
- On slower systems, reduce Data Storage Size to 2000-3000 bars to improve performance
- Disable "Show Debug Labels" for cleaner charts in production trading
- If signals seem too frequent, increase the Pattern Confirmation Window to 15-20
- For cleaner visual output, enable the Transparency Filter for FVGs (if available in your version)
- The indicator works best with at least 1000 historical bars loaded on the chart
Compatibility Notes
- Compatible with all TradingView account types (Free, Pro, Pro+, Premium)
- Works on all TradingView supported exchanges and symbols
- Can be combined with other indicators without conflicts
- Does not interfere with strategy scripts
- Mobile app display may show condensed visuals due to screen size limitations
Known Limitations
- On very low timeframes (1-minute), signal frequency may be high due to increased noise
- During low volatility periods, FVG boxes may be very small and difficult to see
- The indicator's memory requirement increases with Data Storage Size setting
- Maximum of 500 visual objects (labels/lines/boxes) are shown at once due to PineScript limitations
Risk Disclaimer: Trading involves substantial risk of loss. This indicator is a technical analysis tool and does not guarantee profitable trades. Past performance does not indicate future results. All trading decisions should be made based on your own analysis, risk tolerance, and market conditions. The indicator should be used as part of a comprehensive trading plan that includes proper risk management. Never risk more than you can afford to lose.