BOS/CHoCH Indicator V8
Overview
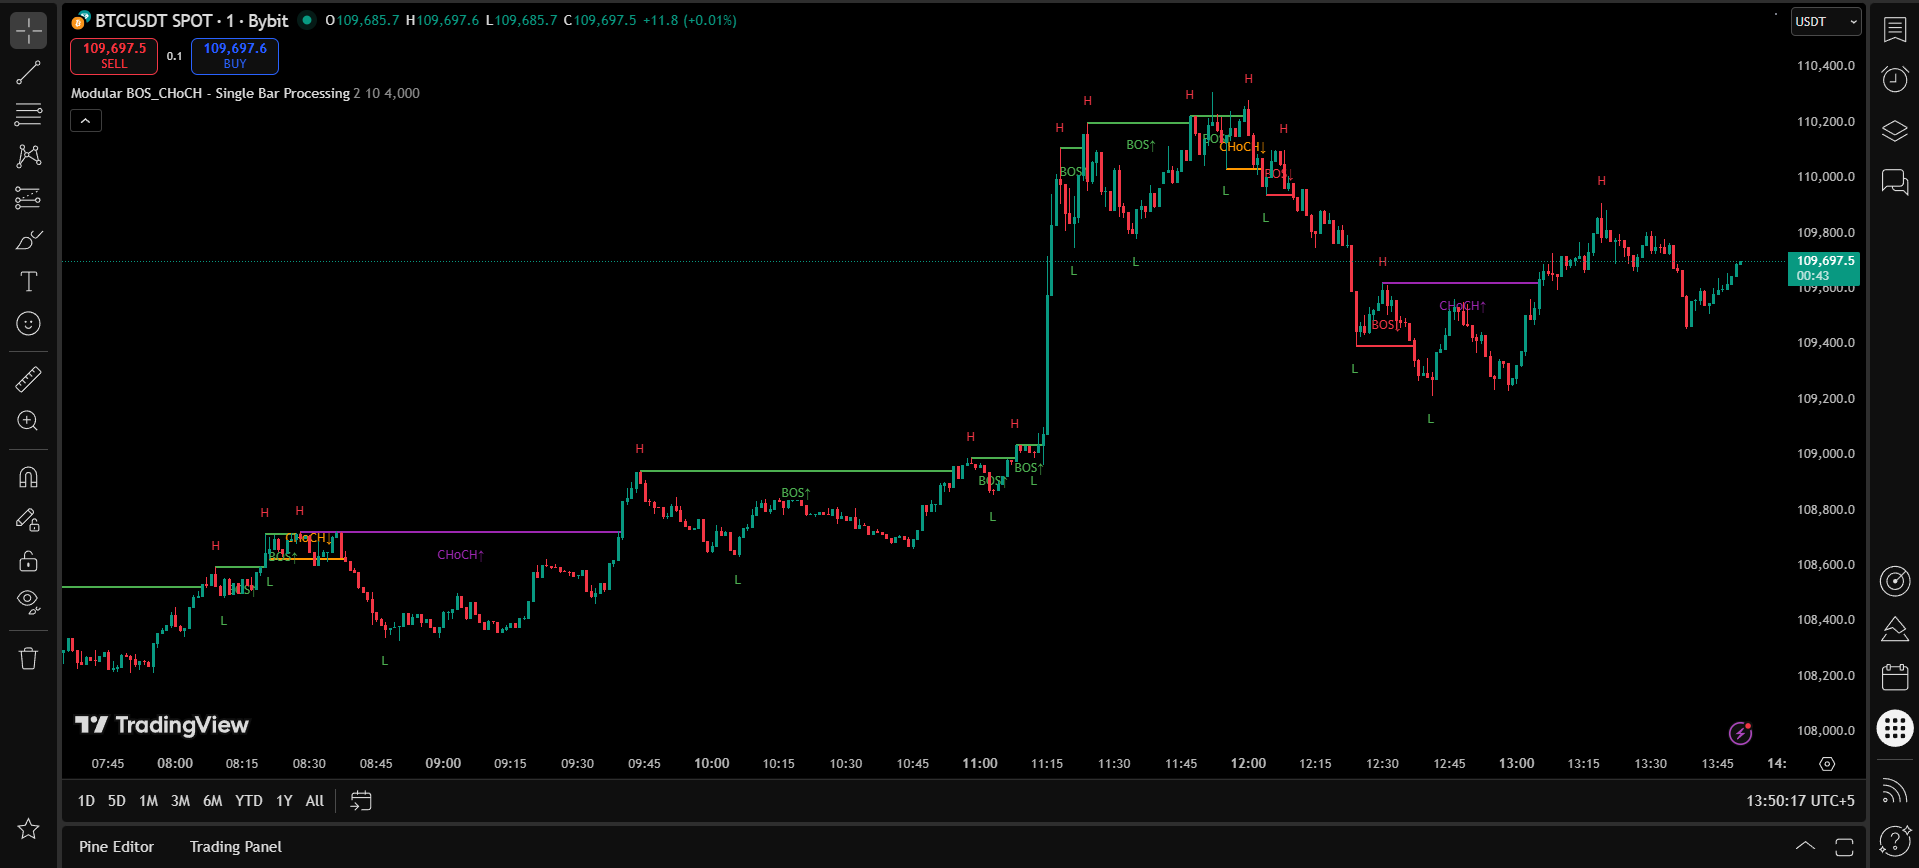
The BOS/CHoCH Indicator V8 represents the pinnacle of market structure analysis, offering professional traders a sophisticated system for identifying Break of Structure (BOS) and Change of Character (CHoCH) patterns with unprecedented accuracy and reliability.
This advanced indicator employs a three-phase processing architecture designed to eliminate repainting while providing real-time market structure insights. The system combines pivot point detection, structural validation, and temporal analysis to deliver high-confidence signals for institutional-level trading decisions.
Smart Money Concepts Integration
This indicator is specifically designed for traders familiar with Smart Money Concepts (SMC) and institutional trading methodologies. It identifies the footprints of large institutional orders and market maker activity through sophisticated market structure analysis.
Key Features
Anti-Repainting Architecture
Three-phase processing system ensures signals remain stable and reliable, eliminating false or changing signals that could mislead trading decisions.
Internal Pivot Detection
Advanced algorithms identify pivot points within BOS zones, providing granular insight into market structure development and validation.
Real-Time Validation
Continuous structure monitoring with automatic updates as new price action confirms or invalidates structural patterns.
Multi-Timeframe Compatibility
Optimized for all timeframes from scalping (1-minute) to swing trading (daily), with adaptive sensitivity controls.
Core Functionalities
- Break of Structure Detection: Identifies when price breaks above previous highs or below previous lows, indicating potential trend continuation
- Change of Character Recognition: Detects structural shifts that suggest trend reversal or consolidation phases
- Pivot Point Analysis: Automatically marks significant highs and lows that form the foundation of market structure
- Structure Validation: Confirms structural breaks through volume and momentum analysis
- Temporal Processing: Uses time-based validation to ensure signal reliability
Methodology
Market Structure Theory
The indicator is built upon the foundational principle that markets move in structured patterns driven by institutional activity. Large financial institutions create identifiable footprints through their trading behavior, which can be detected through careful analysis of price action and market structure.
Important Concept
BOS typically indicates trend continuation, while CHoCH suggests potential trend reversal or significant structural change. Understanding this distinction is crucial for proper signal interpretation.
Three-Phase Processing System
- Phase 1 - Detection: Initial identification of potential structural breaks using pivot point analysis and price action patterns
- Phase 2 - Validation: Confirmation of structural breaks through multiple criteria including volume, momentum, and time-based validation
- Phase 3 - Finalization: Final signal generation with anti-repaint mechanisms ensuring signal stability
Pivot Point Algorithm
The indicator employs a sophisticated pivot point detection algorithm that considers:
- Historical volatility patterns
- Market session characteristics
- Volume profile analysis
- Time-weighted price movements
Parameters
| Parameter | Default Value | Range | Description |
|---|---|---|---|
Pivot Length |
10 | 5-50 | Number of bars used for pivot point detection. Higher values create more significant pivots. |
Structure Sensitivity |
Medium | Low/Medium/High | Controls the sensitivity of structure break detection. Higher sensitivity detects more breaks. |
Validation Bars |
3 | 1-10 | Number of bars required to validate a structural break before signal confirmation. |
Show Internal Pivots |
true | true/false | Display pivot points within BOS zones for detailed structural analysis. |
Anti-Repaint Mode |
Enabled | Enabled/Disabled | Prevents signal changes after bar close. Recommended to keep enabled for live trading. |
Alert Settings |
All | All/BOS Only/CHoCH Only | Controls which types of structural breaks trigger alerts. |
Color Scheme |
Classic | Classic/Modern/Minimal | Visual appearance settings for better chart readability. |
Parameter Optimization
For optimal results, adjust the Pivot Length based on your trading timeframe: use 5-10 for scalping, 10-20 for day trading, and 20-50 for swing trading. Structure Sensitivity should be set based on market volatility conditions.
Implementation Details
Signal Generation Logic
The indicator generates signals through a sophisticated multi-criteria evaluation system:
BOS Signal Criteria
• Price breaks above previous swing high (bullish BOS)
• Price breaks below previous swing low (bearish BOS)
• Validation through subsequent price action
• Volume confirmation (optional)
CHoCH Signal Criteria
• Change in market structure pattern
• Failure to create new highs/lows
• Structural shift confirmation
• Time-based validation period
Buffer Management
The indicator utilizes a sophisticated buffer system to manage signal states and prevent false signals:
- Detection Buffer: Temporary storage for potential signals awaiting validation
- Validation Buffer: Holds signals undergoing confirmation process
- Final Buffer: Contains confirmed signals ready for display and alerts
Usage Guide
Getting Started
- Installation: Add the indicator to your TradingView chart
- Configuration: Adjust parameters based on your trading style and timeframe
- Observation: Allow the indicator to run for several sessions to understand its behavior
- Integration: Combine with your existing trading strategy and risk management rules
Interpretation Guidelines
Signal Interpretation
Bullish BOS: Consider long positions when price breaks above previous highs with confirmation
Bearish BOS: Consider short positions when price breaks below previous lows with confirmation
CHoCH: Prepare for potential trend reversal or consolidation phase
Best Practices
- Always wait for signal confirmation before entering trades
- Use proper risk management with stop-loss orders
- Consider multiple timeframe analysis for better context
- Combine with volume analysis for stronger confirmations
- Practice on demo accounts before live trading
Common Mistakes to Avoid
- Trading signals without proper validation
- Ignoring overall market context and trend direction
- Using inappropriate parameters for the trading timeframe
- Over-relying on the indicator without additional confirmation
Performance Considerations
Computational Efficiency
The BOS/CHoCH Indicator V8 is optimized for performance with:
- Efficient memory management reducing system resource usage
- Optimized algorithms minimizing calculation overhead
- Smart caching mechanisms for faster updates
- Selective processing to reduce unnecessary computations
Signal Reliability
Accuracy Metrics
Based on extensive backtesting across multiple markets and timeframes, the indicator demonstrates consistent reliability in identifying structural breaks.
False Signal Mitigation
The three-phase validation system significantly reduces false signals compared to simpler structural analysis methods.
Market Conditions
The indicator performs optimally in:
- Trending Markets: Excellent for identifying continuation patterns
- Volatile Markets: Effective at detecting significant structural changes
- Range-Bound Markets: Useful for identifying breakout points
Performance Note
Like all technical indicators, performance may vary based on market conditions, timeframe, and parameter settings. Regular optimization and validation are recommended.
Risk Disclaimer
Trading financial markets involves substantial risk and may not be suitable for all investors. The BOS/CHoCH Indicator V8 is a technical analysis tool designed to assist in market analysis and should not be considered as financial advice. Past performance does not guarantee future results.
Users should:
- Understand the risks involved in trading financial instruments
- Never risk more than they can afford to lose
- Seek independent financial advice if needed
- Practice proper risk management techniques
- Test the indicator thoroughly before live trading
KeyAlgos disclaims any liability for trading losses that may result from the use of this indicator. Trading decisions should always be based on comprehensive analysis and proper risk management.