Consolidation Region V2
Overview
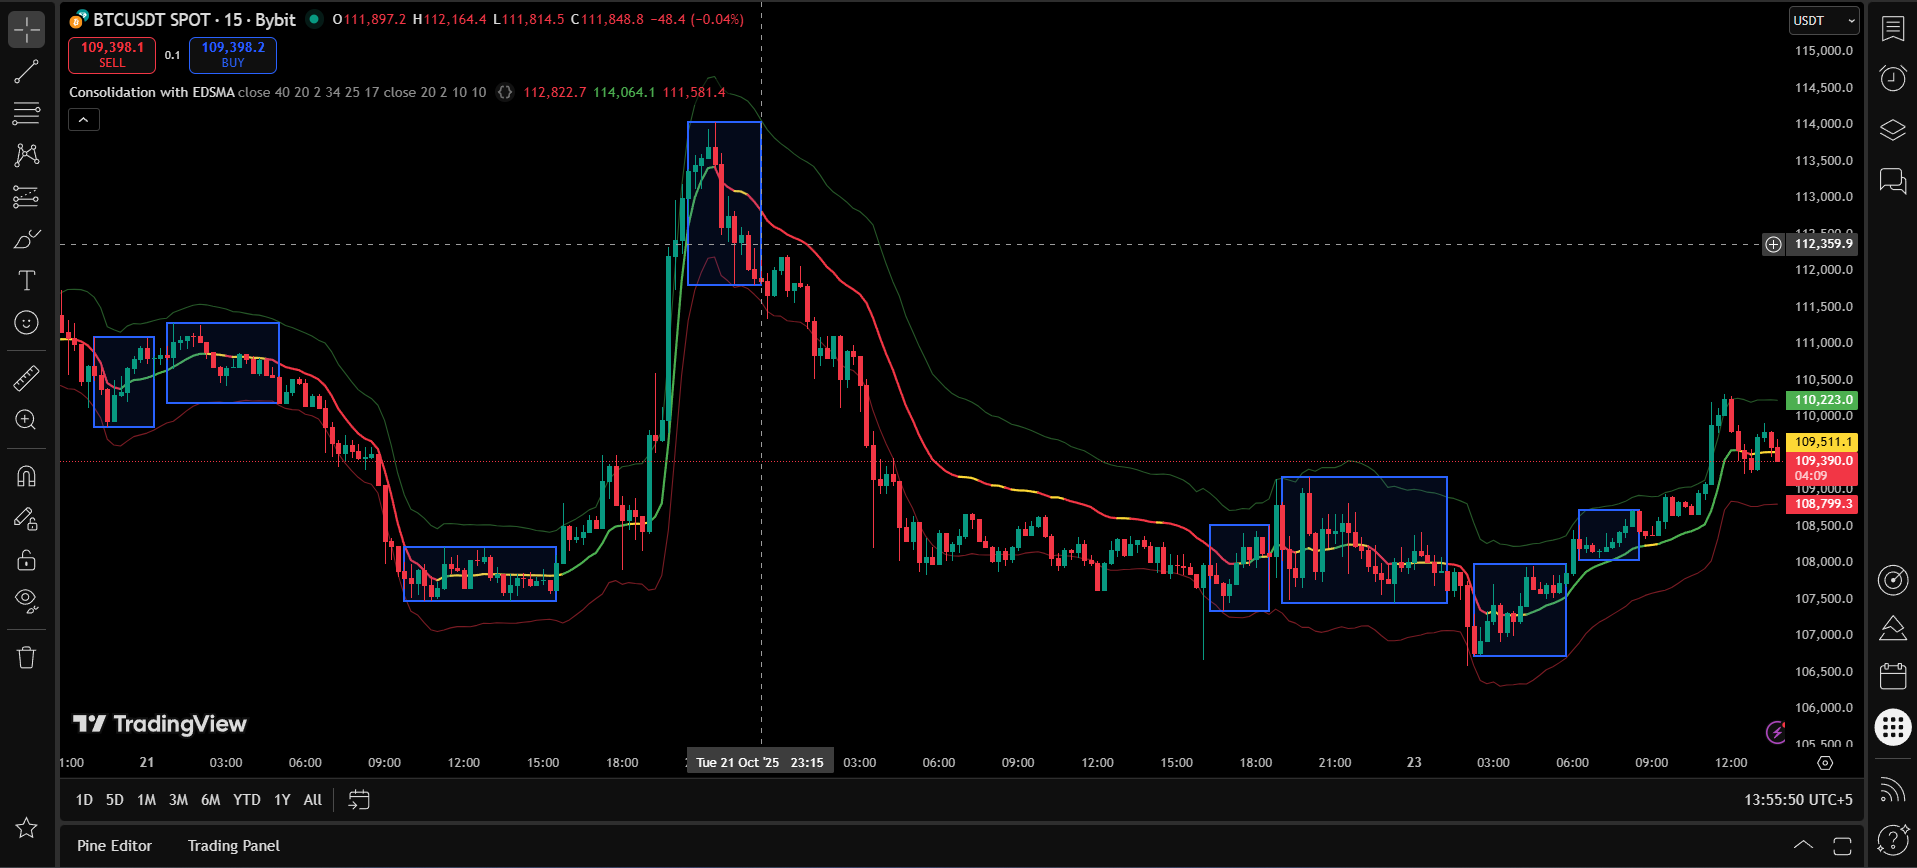
The Consolidation Region V2 indicator is a sophisticated tool designed to identify range-bound market conditions using the Ehlers Dynamic Smoothed Moving Average (EDSMA) methodology. This advanced system combines trend analysis with volatility measurements to accurately detect consolidation phases.
By utilizing ATR-based bands and slope filtering, the indicator effectively distinguishes between trending and consolidating market conditions, providing traders with clear visual confirmation of range-bound opportunities.
Advanced Consolidation Detection
This indicator uses cutting-edge mathematical models to identify consolidation zones with unprecedented accuracy, helping traders optimize their range-trading strategies.
EDSMA Methodology
Ehlers Dynamic Smoothed Moving Average
The EDSMA is an advanced moving average developed by John Ehlers that adapts to market conditions by adjusting its smoothing factor based on price velocity and volatility.
where α = 2 / (Period + 1) × Adaptive Factor
The adaptive factor adjusts based on market conditions, making the average more responsive during volatile periods and smoother during consolidation phases.
Dynamic Trend Assessment
The EDSMA continuously evaluates price momentum and adjusts its sensitivity accordingly:
- High Velocity: Increased responsiveness to capture trend changes
- Low Velocity: Enhanced smoothing to filter noise
- Volatility Adjustment: Automatic calibration based on market conditions
Key Features
ATR-Based Bands
Dynamic bands calculated using Average True Range to define consolidation boundaries with automatic volatility adjustment.
Slope Filtering
Advanced slope analysis excludes trending bars from consolidation detection, ensuring accurate range identification.
Real-Time Detection
Continuous monitoring of price action with immediate identification of consolidation entry and exit points.
Multi-Timeframe Support
Optimized performance across all timeframes from scalping to position trading with adaptive parameters.
Parameters
| Parameter | Default | Range | Description |
|---|---|---|---|
| EDSMA Period | 14 | 5-50 | Period for EDSMA calculation |
| ATR Period | 14 | 5-30 | Period for ATR band calculation |
| Band Multiplier | 1.5 | 0.5-3.0 | ATR multiplier for band width |
| Slope Threshold | 0.1 | 0.01-1.0 | Minimum slope for trend exclusion |
| Min Consolidation Bars | 10 | 5-50 | Minimum bars required for consolidation |
Parameter Optimization
For volatile markets, increase the ATR period and band multiplier. For smoother markets, reduce these values to capture smaller consolidation zones.
Implementation Details
Detection Algorithm
The indicator employs a multi-stage detection process:
- EDSMA Calculation: Dynamic smoothing based on market velocity
- ATR Band Generation: Volatility-adjusted boundary calculation
- Slope Analysis: Trend strength evaluation and filtering
- Consolidation Validation: Minimum duration and stability checks
Range Boundary Logic
Consolidation zones are identified when:
- Price remains within ATR bands for specified duration
- EDSMA slope stays below threshold value
- No significant breakout signals detected
- Volatility remains within normal range
Usage Guide
Trading Applications
Range Trading
Buy at lower band, sell at upper band within identified consolidation zones.
Breakout Preparation
Position for potential breakouts when consolidation patterns mature.
Volatility Trading
Adjust position sizing based on consolidation band width.
Best Practices
- Wait for full consolidation confirmation before range trading
- Use multiple timeframes for context validation
- Monitor for breakout signals at band extremes
- Implement proper risk management within ranges
Risk Disclaimer
Trading involves substantial risk and may not be suitable for all investors. The Consolidation Region V2 indicator is a technical analysis tool and should not be considered as financial advice. Past performance does not guarantee future results. Always use proper risk management and never risk more than you can afford to lose.