Pivot & Trend Detection w/ Decay Methods
Overview
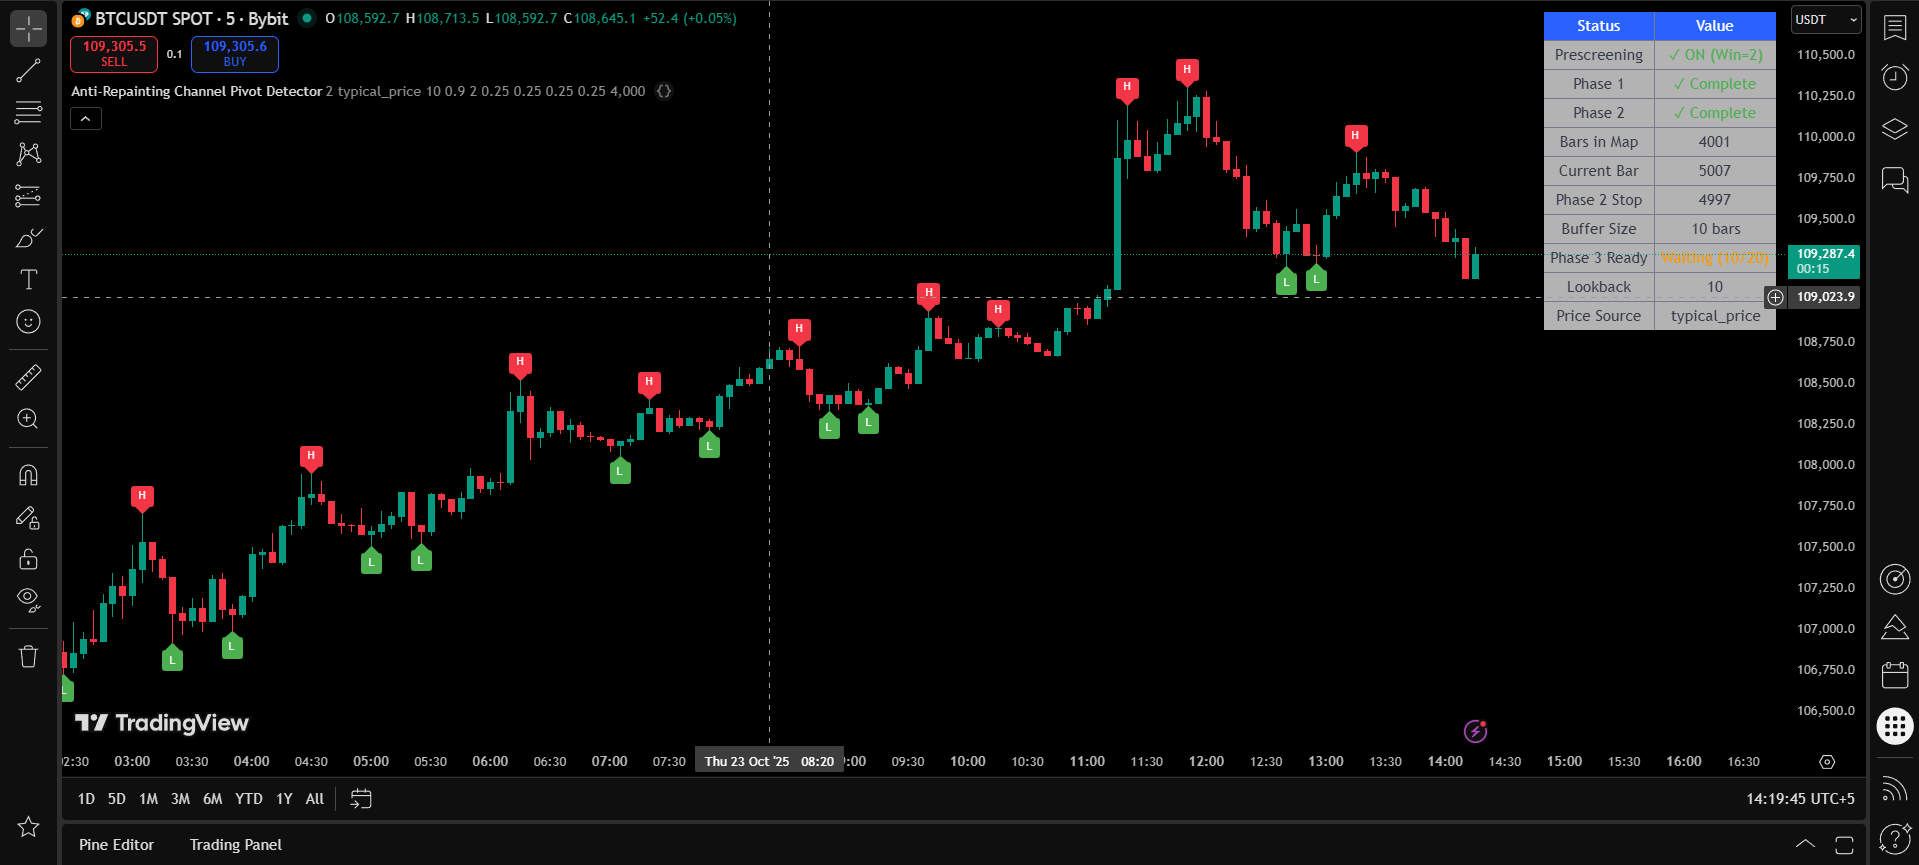
The Pivot & Trend Detection with Decay Methods indicator represents an advanced approach to identifying key reversal points using sophisticated mathematical weighting techniques. This system combines four distinct decay methodologies to provide comprehensive trend analysis with exceptional accuracy.
By employing weighted trend analysis through EMA, linear, exponential, and Gaussian decay methods, the indicator offers traders unprecedented insight into market momentum shifts and pivot point significance.
Revolutionary Approach
This indicator pioneers the use of multiple decay functions in pivot detection, providing more nuanced and accurate identification of significant market turning points.
Decay Methods
where α = 2/(period+1)
Linear decrease over time
where λ is decay constant
Normal distribution weighting
Method Comparison
Each decay method offers unique advantages:
- EMA Decay: Best for trending markets with consistent momentum
- Linear Decay: Ideal for balanced analysis across all time periods
- Exponential Decay: Optimal for volatile markets requiring quick adaptation
- Gaussian Decay: Superior for smooth trend identification with noise reduction
Detection Process
Anti-Repainting Architecture
The indicator employs a sophisticated buffer zone system that ensures:
- Signals remain stable after bar close
- No retroactive changes to historical signals
- Reliable performance for automated trading systems
- Consistent behavior across all timeframes
Parameters
| Parameter | Default | Range | Description |
|---|---|---|---|
| Pivot Length | 14 | 5-50 | Period for pivot point detection and calculation |
| EMA Period | 20 | 10-100 | Period for EMA decay method calculation |
| Decay Constant (λ) | 0.1 | 0.01-1.0 | Exponential decay rate parameter |
| Gaussian Sigma (σ) | 3.0 | 1.0-10.0 | Standard deviation for Gaussian weighting |
| Buffer Zone Size | 3 | 1-10 | Anti-repainting buffer size in bars |
| Significance Threshold | 0.7 | 0.1-1.0 | Minimum weighted significance for pivot validation |
| Method Weighting | Equal | Equal/Custom | Individual method importance weighting |
Optimization Guidelines
For scalping, use shorter pivot lengths (5-10) with smaller buffer zones. For swing trading, increase pivot length (20-50) and use larger buffer zones for stronger confirmation.
Implementation Details
Computational Efficiency
The indicator is optimized for performance through:
- Parallel Processing: Simultaneous calculation of all decay methods
- Smart Caching: Efficient storage and retrieval of weighted calculations
- Adaptive Sampling: Dynamic adjustment based on market volatility
- Memory Management: Optimized data structures for large datasets
Signal Quality Assurance
Multiple validation layers ensure signal reliability:
- Cross-Method Validation: Confirmation across multiple decay methods
- Trend Consistency: Verification against overall market direction
- Volatility Adjustment: Dynamic threshold adaptation for market conditions
- Historical Backtesting: Continuous validation against past performance
Real-Time Processing
The system processes market data in real-time with:
- Sub-second calculation updates
- Immediate alert generation upon signal confirmation
- Seamless integration with trading platforms
- Minimal impact on system resources
Usage Guide
Setup and Configuration
Configure the indicator by selecting appropriate parameters based on your trading timeframe and market volatility. The system automatically adapts to different asset classes and market conditions.
Signal Interpretation
Trading Applications
- Reversal Trading: High confidence pivots for counter-trend entries
- Trend Following: Low confidence pivots for trend continuation
- Support/Resistance: Pivot levels as key price zones
- Risk Management: Stop loss placement beyond pivot levels
Risk Disclaimer
Trading involves substantial risk and may not be suitable for all investors. The Pivot & Trend Detection with Decay Methods indicator is a technical analysis tool and should not be considered as financial advice. Past performance does not guarantee future results. Always use proper risk management and never risk more than you can afford to lose.